Logs
The logs are presented in chronological order, with the most recent events at the top. Each entry includes a timestamp, a severity icon, the log message, and the specific service or identifier that generated the event.
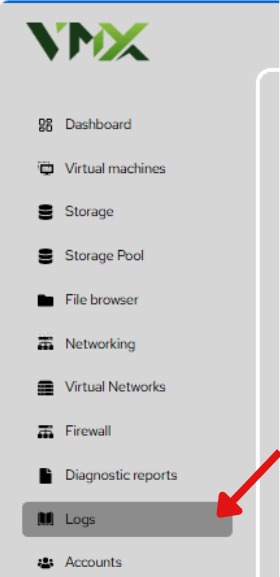
Steps To Follow:
- Click on Logs menu from the list. It will navigate you to the Logs page.
To quickly find relevant information in a high-volume environment, use the top navigation bar:
- Time Range: Filter logs by duration (e.g., "Last 24 hours," "Last week," or a custom range).
- Priority: Filter by the importance of the event. Common settings include:
- Debug: Detailed information for development.
- Info: Standard operational messages.
- Notice/Warning: Non-critical issues that may require attention.
- Error and above: Critical failures that impact system performance or stability.
- Identifier: View logs from a specific service only, such as kernel, libvirt, systemd, or cockpit-session.
- Search/Filters: Use the search bar to look for specific keywords or use advanced syntax (e.g., priority:err) to isolate critical issues.