Dashboard
The main dashboard provides a real-time summary of the host's performance and security status.
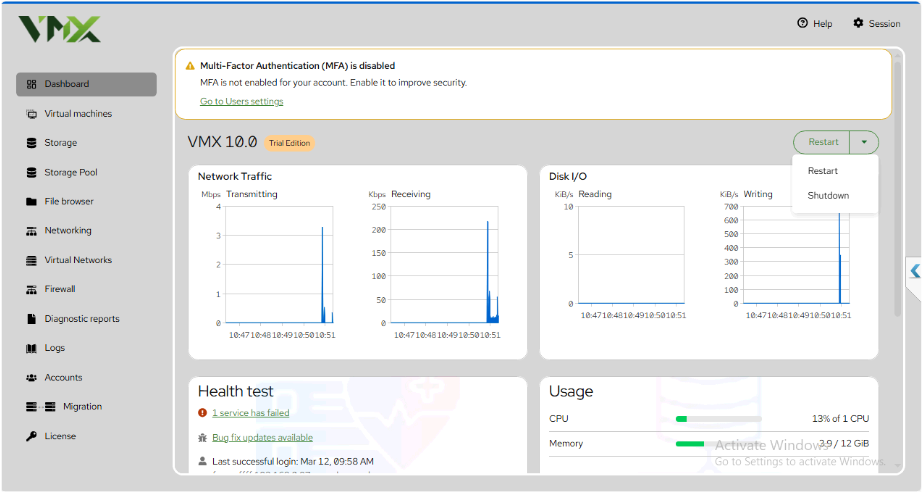
- MFA Alert: A security banner at the top monitors Multi-Factor Authentication status. It is highly recommended to enable this in the Accounts section.
- Performance Graphs: Live charts track Network Traffic (Transmitting/Receiving) and Disk I/O (Reading/Writing).
- System Controls: The Restart button in the top right includes a dropdown menu for safe Shutdown procedures.
- Usage Summary: Displays current CPU and Memory consumption. For example, a 9% CPU load and 3.9/12 GiB RAM usage indicates a healthy, stable system.
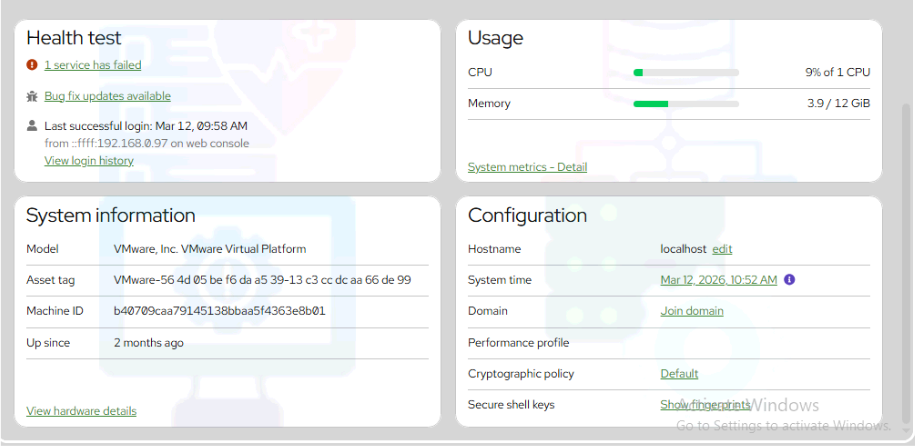
- Health Test: Displays critical service status. If "1 service has failed," click the link to diagnose the specific daemon.
- Update Management: The Available updates screen lists pending patches.
- Severity: Icons indicate if a patch is a standard update or a critical security fix.
- Note: Installing updates may require a Web Console restart. Click Install all updates to proceed.
- Settings: You can enable Automatic updates to ensure the system stays current without manual intervention.